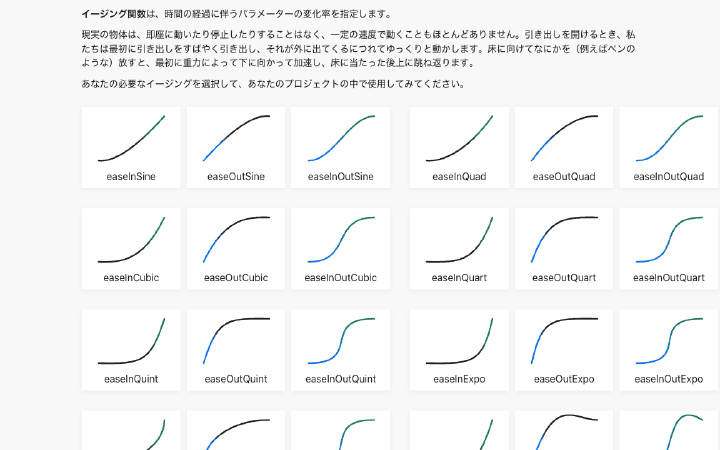
Easing Functions Cheat Sheet
A cheat sheet for comparing easing functions such as Sine, Quad, Expo, and Bounce through curves, CSS, and TypeScript code.
A cheat sheet for comparing easing functions such as Sine, Quad, Expo, and Bounce through curves, CSS, and TypeScript code.
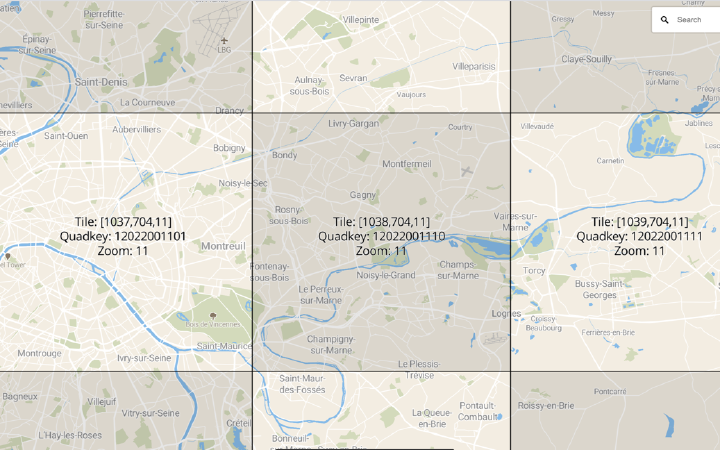
An interactive tool for inspecting map tile bounds, coordinates, and Quadkeys at each zoom level.
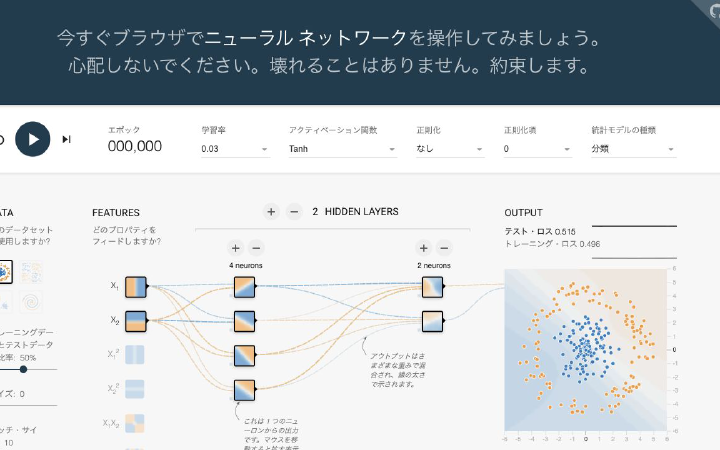
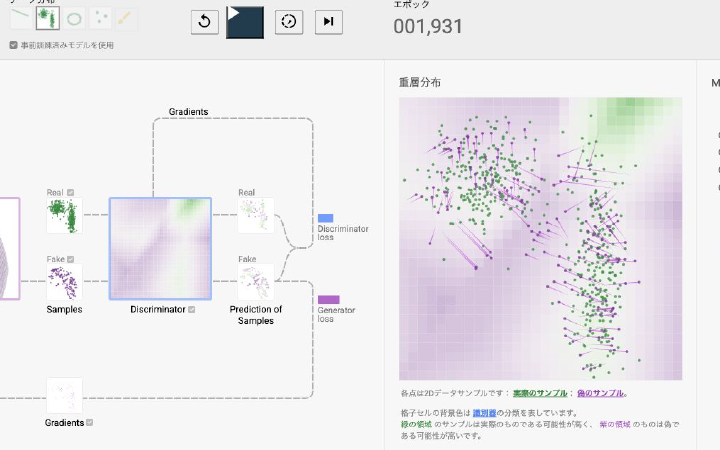
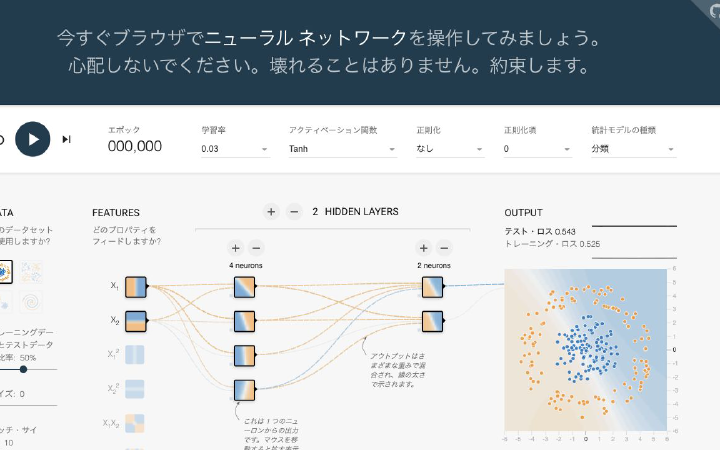
An interactive browser-based visualization tool for experimenting with how neural networks learn.
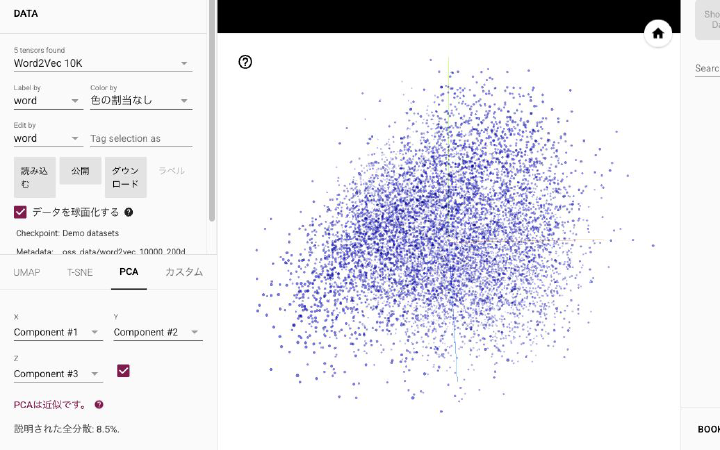
A visualization tool for projecting high-dimensional embeddings into 2D or 3D and exploring neighbors and clusters.
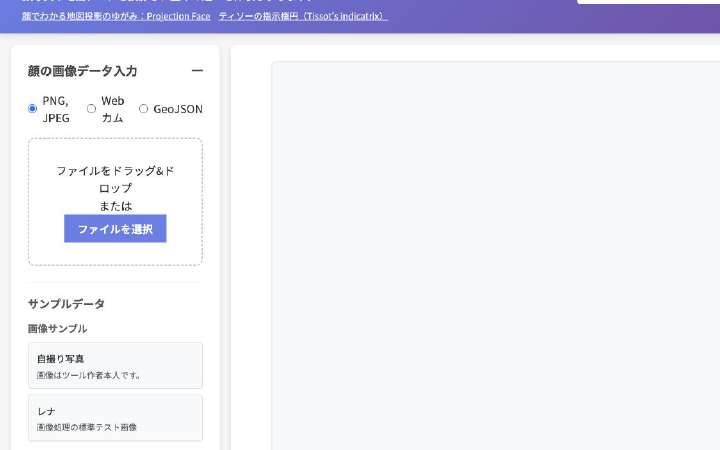
Interactive content for projecting face photos or GeoJSON and experiencing distortion across map projections.
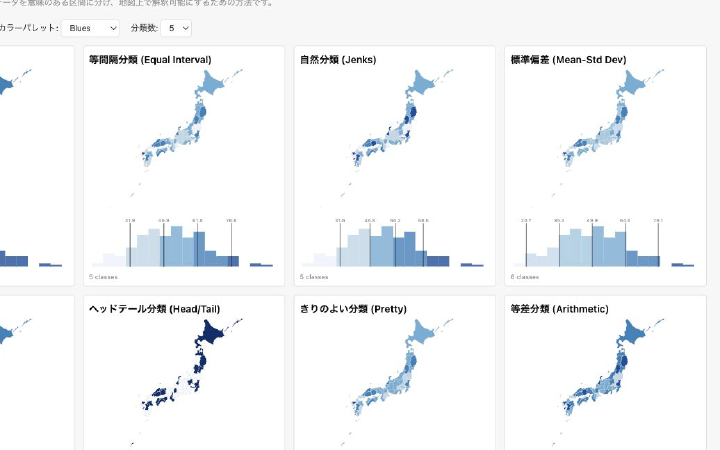
An interactive comparison of multiple GIS classification methods against the same data distributions.
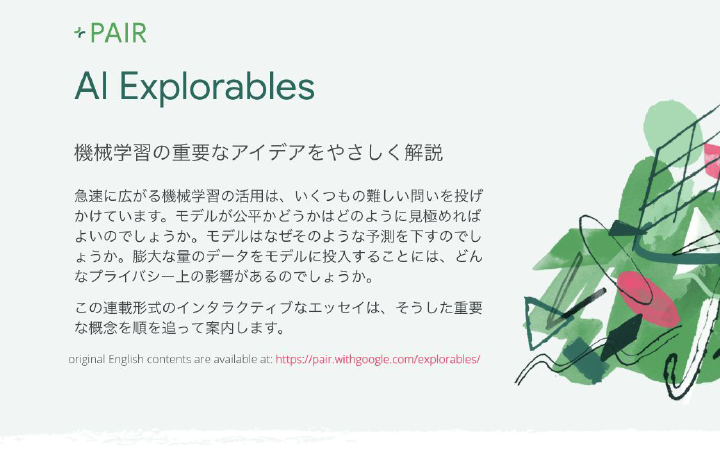
Interactive explainers from Google PAIR for learning how AI works and how it affects society.
An interactive learning resource for network layouts, centrality, clustering, and path finding.
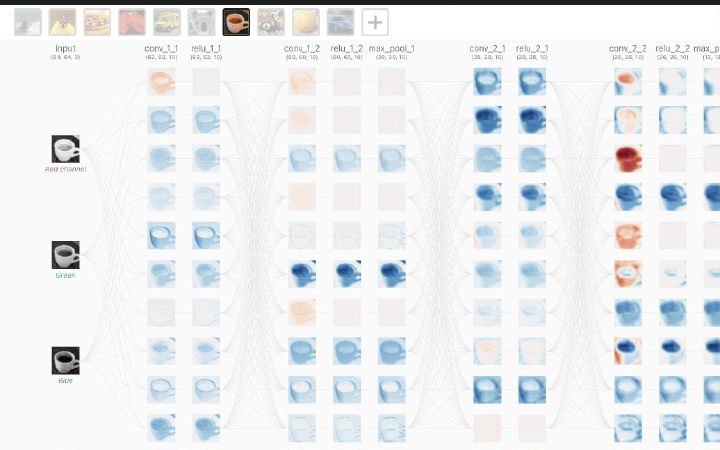
An interactive tool for following how images are processed through the layers of a convolutional neural network.
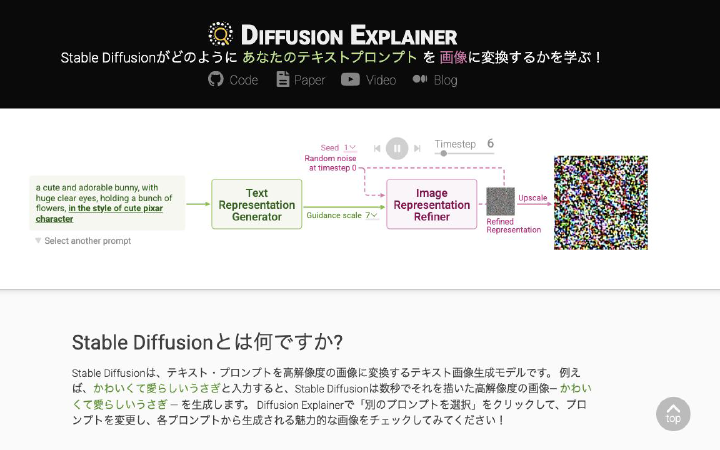
A visual explainer for learning how Stable Diffusion generates images from text prompts step by step.
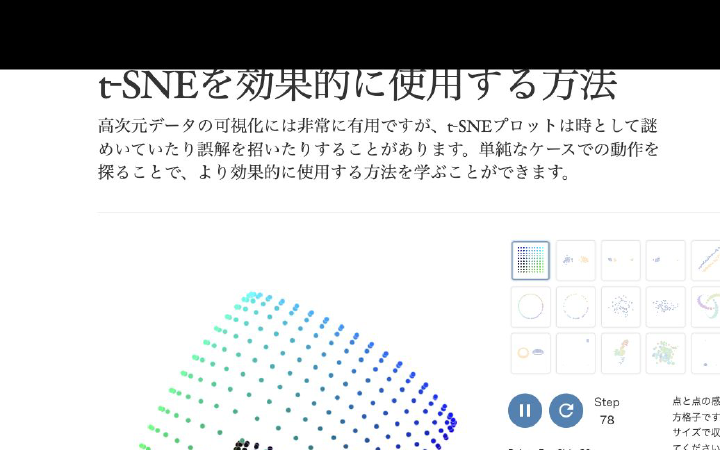
An article for learning how parameters and data structure affect t-SNE plots so they are not overinterpreted.

Visual explainers from Amazon Machine Learning University for learning core machine learning concepts.
A 3D visualization tool for drawing handwritten digits and observing MLP activations and prediction probabilities.

An interactive article for experiencing how small individual preferences can create large-scale social segregation.
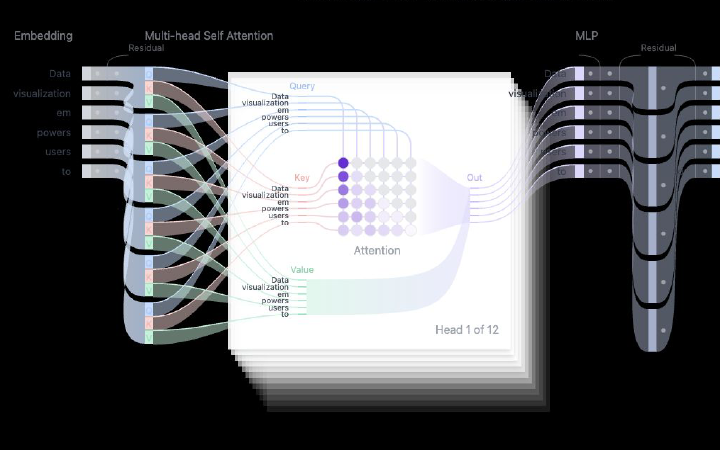
An interactive visualization tool for learning how tokens and attention work inside a text generation Transformer.
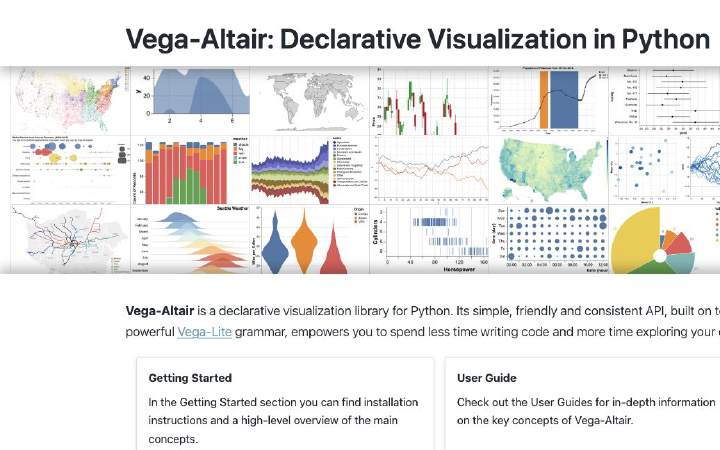
A Vega-Lite-based visualization library for building statistical graphics declaratively from Python.