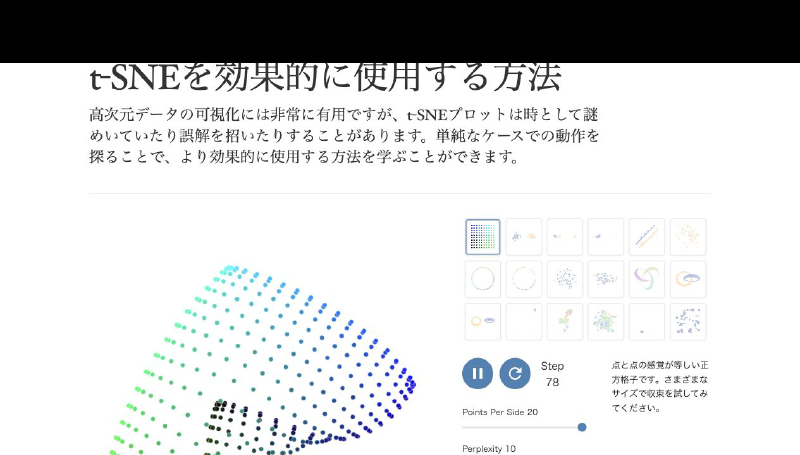
How to Use t-SNE Effectively is an interactive article about how to interpret t-SNE, a common method for visualizing high-dimensional data. It shows how cluster size, distances between clusters, randomness, and perplexity can affect the appearance of a plot.
By changing sample data and parameters, you can see that the same dataset can produce very different visual results. The article is an important learning resource for understanding what can be trusted in a t-SNE plot and what should not be overinterpreted.
