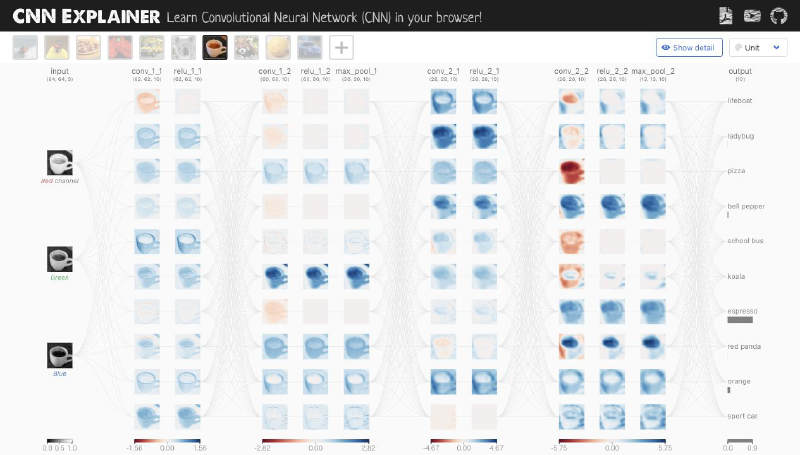
CNN Explainer is interactive content that traces how a convolutional neural network (CNN) classifies an image through layer-by-layer visualization. You can see how the input image is transformed through convolution, activation, pooling, and fully connected layers.
Because filters, feature maps, neuron activations, and final prediction probabilities are shown in the same context, the tool makes it easier to connect the model structure with the flow of inference. It is a useful learning tool for explaining what happens inside an image recognition model.
What you’ll learn
- The overall path an input image takes through a CNN on its way to being classified into one of 10 classes (repeated blocks of convolution → ReLU → pooling)
- What each of the three basic operations — convolution, ReLU, and pooling — actually does to an image
- How clicking a single neuron reveals the exact multiply-and-sum formula behind its output
Walkthrough
Work your way from the input image on the left to the output probabilities on the right.
- Pick an input image: Choose one of the 10 thumbnails at the top (lifeboat, ladybug, pizza, bell pepper, school bus, koala, espresso, red panda, orange, sport car), or click the “+” button to upload your own.
- Input layer: Watch the chosen image get read in as a 64x64 RGB image and split into Red, Green, and Blue channels.
- First convolution block (conv_1_1 → relu_1_1 → conv_1_2 → relu_1_2): Ten filters are applied to each channel, producing feature maps that shrink from 62x62 to 60x60. The ReLU layers clip every negative value down to zero.
- Click a neuron to see the formula: Click any cell in any layer to open a detail view showing exactly how that output was computed — an input/output matrix plus the underlying formula. Hover over the grid to see the calculation change for different pixels.
- Pooling layer (max_pool_1): The feature maps are downsampled to 30x30, making the network more tolerant of small shifts in where an object appears.
- Second convolution block (conv_2_1 → relu_2_1 → conv_2_2 → relu_2_2 → max_pool_2): The same sequence of operations repeats, compressing everything down to 13x13x10.
- Output (10-class probabilities): A final softmax produces a probability for each of the 10 classes, and the highest one is shown as the predicted class.
- Toggle “Show detail” and “Unit”: The controls in the top right switch to a more detailed view of the computation, or a different unit of display.
Background
CNN Explainer comes from Georgia Tech’s Polo Club — the same group behind Transformer Explainer and GAN Lab — published as the paper “CNN Explainer: Learning Convolutional Neural Networks with Interactive Visualization” (Wang et al., IEEE VIS 2020). What it visualizes is Tiny VGG, a small CNN modeled after VGGNet’s architecture, trained to classify images into 10 classes.
The convolutional neural network as a design goes back to Yann LeCun’s LeNet (1998), and through AlexNet (2012) and VGGNet (2014) became the foundation of today’s image recognition models.
Takeaways
- A CNN extracts increasingly high-level features from an image by repeating a simple sequence: convolution, ReLU, pooling
- As you go deeper, feature maps shrink in width and height while the features each channel captures become more abstract
- Clicking individual neurons to inspect the formula turns the phrase “feature extraction” into something you can see as an actual calculation
